
Last Updated on June 29, 2026
ACT Science Practice Test 1 (40 questions) with Answers and Explanation. You can download Full ACT Science Practice Test PDF in a printable and editable file for free. Prepare your ACT Science final exam test.
ACT Science Practice Test 1
| Test Name | ACT Test Prep |
|---|---|
| Category | Free ACT Practice Test |
| Knowledge tested | ACT Science Test |
| Type of Question | Sample Multiple Choice |
| Topics | Data representation, Research summary, Conflicting viewpoints |
| Total Question (MCQ) | 40 |
| Total time duration | 35 minutes |
| Answers Available | YES |
| Recommended Devices | Use a laptop or desktop |
| Printable PDF | Available |
The passages in this test are followed by several questions. After reading each passage, choose the best answer to each question. You may refer back to the passages as often as necessary. You are not permitted to use a calculator on this test.
ACT Science Passage I—Data Representation
The earth’s gravitational force produces a downward acceleration of 9.8 m/s2 on all objects near the earth’s surface. Other forces, including those produced by wind and aerodynamic lift, as well as jet, rocket, internal combustion or other engines may also exert upward or downward forces on these objects. These other forces, acting in combination with gravity, can cause a net force greater than or less than gravity, and, therefore, a net acceleration different from the downward acceleration of 9.8 m/s2 caused by gravity.
Table 1 and Figure 1 provide information about the vertical velocities measured for three different objects without regard to the horizontal motion of the objects. Each of the objects is operating under the influence of gravity for the entire 45 seconds being studied. They each may also be influenced by other vertical forces for all or part of that period. Where other forces have been applied, they always begin and end at one of the 5-second intervals.
Table 1 indicates the vertical velocities of the three different objects as measured every 5 seconds. Positive velocities indicate motion upward, and negative velocities indicate motion downward.
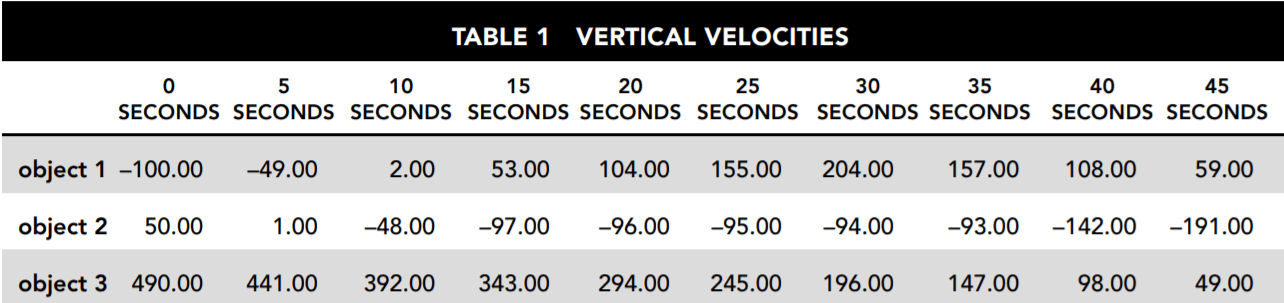
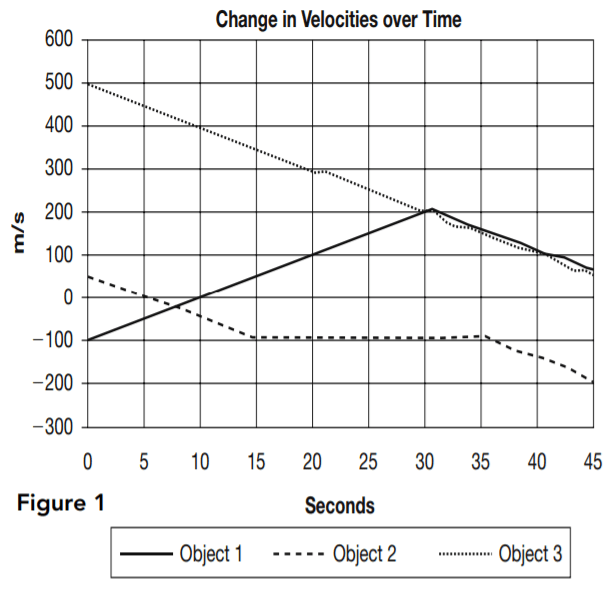
Figure 1 is a graphical representation of the velocity of each object at every point during the 45 seconds under review.
1. Which of the three objects may be traveling solely under the influence of gravity for the entire period shown?
- A. only object 2
- B. objects 1 and 2
- C. objects 1 and 3
- D. only object 3
2. For the time period shown, which of the three objects is/are traveling solely under the influence of gravity for at least part of the 45-second period?
- A. only object 2
- B. objects 1, 2, and 3
- C. only object 1
- D. only object 3
3. For second 5 through second 25, which of the objects is/are moving with constant acceleration?
- A. only object 3
- B. objects 1, 2, and 3
- C. objects 2 and 3
- D. objects 1 and 3
4. Which answer best describes the motion of object 1?
- A. It travels downward from second 0 for 9.8 seconds. Then it travels upward with increasing speed until second 30. It continues to move upward at a continually decreasing speed until second 45.
- B. It travels upward at a constant speed from second 0 to second 30 and then travels downward at a constant speed until second 45.
- C. It travels downward from second 0 for 9.8 seconds. Then it travels upward with increasing speed until second 30. It then continues to move upward with a more gradual increase in speed until second 45.
- D. It travels upward at increasing speed until second 30 and then continues upward at decreasing speed until second 45.
5. From second 15 to second 35 the velocity of object 2 undergoes only very small changes. What is the best explanation for this?
- A. It leveled off and was flying at the same altitude for that time period.
- B. An upward force adequate to cause an acceleration of 0.2 m/s2 was applied.
- C. An upward force adequate to cause an acceleration of 10 m/s2 was applied.
- D. The force of gravity was reduced because it was flying over a deep valley
ACT Science Passage II—Research Summary
Titration is a method used to measure the concentration level of a given substance in a solution. A solution of known concentration, called the titrant, is slowly added, in measured amounts, to the solution being titrated. The titrant must contain a substance that reacts with the titrated solution, and the reaction must be measurable. Once the two substances have fully reacted, we know the mass of the titrant used
and can calculate the mass of the titrated substance.
The reaction of hydrochloric acid (HCl) and sodium hydroxide (NaOH), a strong base, is represented as HCl + NaOH → H2O + NaCl. This experimental series involves three trials. Each uses a sodium hydroxide solution at 0.2 M concentration as the titrant. The solution to be titrated is precisely 20 ml of hydrochloric acid solution at a concentration between 0.1 M and 0.3 M. (A 1.0 M concentration means 1.0 mole/1.0 liters of water.) The resulting products, water and sodium chloride, are acid neutral. When pH 7.0 (acid neutrality) is reached,
the reaction is complete.
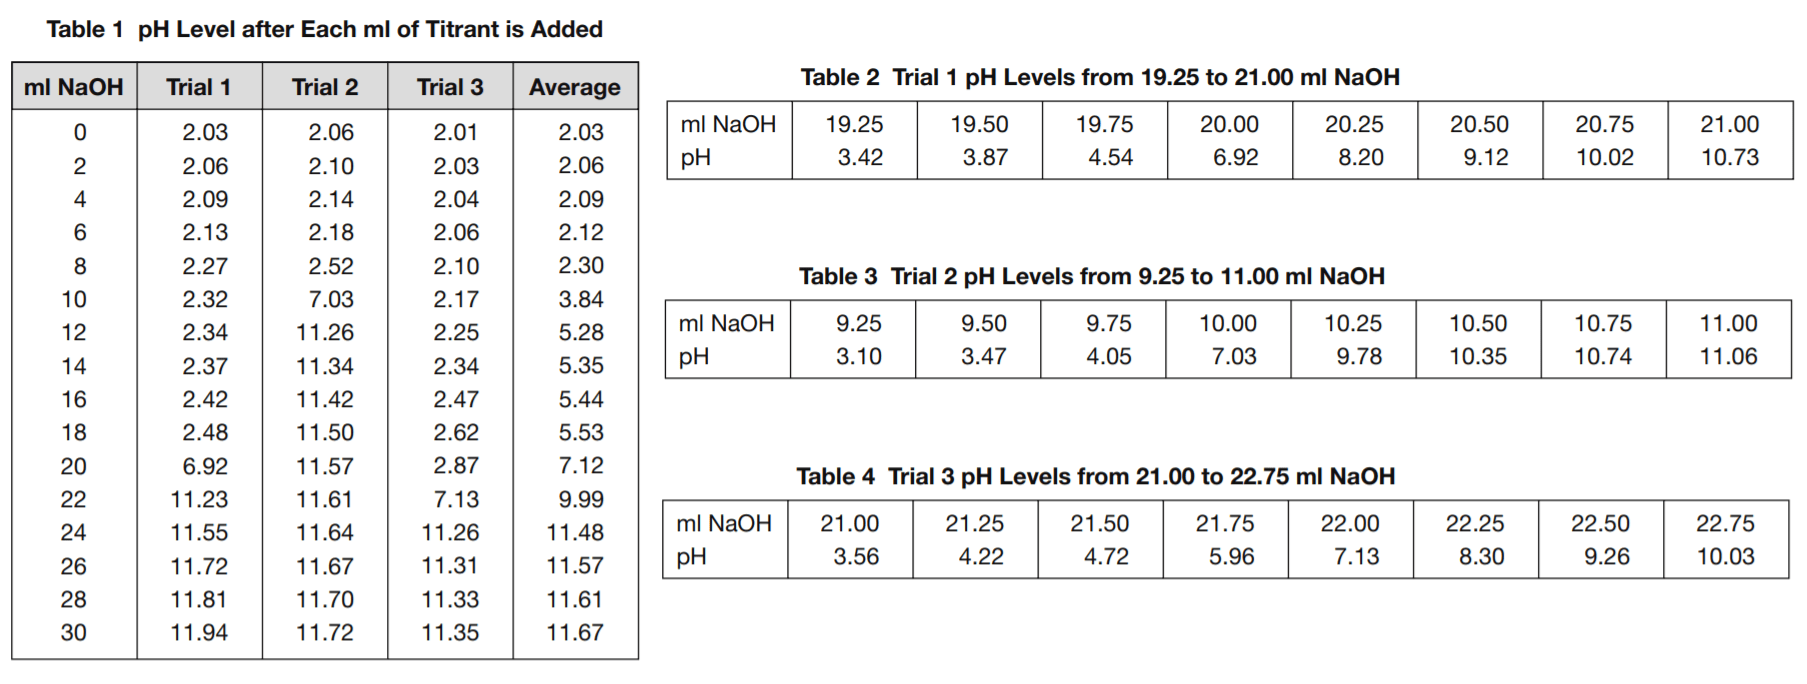
Table 1 shows the pH values after each addition of 2 ml of the titrant, up to 30 ml, for each of the three trials.
Tables 2, 3, and 4 show a detailed view of what happens to the pH levels in the vicinity of pH 7.0 as titrant is added.
6. Based on the formula for the reaction between hydrochloric acid and sodium hydroxide, how many moles of sodium hydroxide are required to fully react with one mole of hydrochloric acid?
- A. 2
- B. 4
- C. 1
- D. 3
7. The molar mass of HCl is 36.5 grams and the molar mass of NaOH is 40.0 grams. How many grams of HCl must be dissolved in a 20 ml solution to bring it to a concentration of 0.1 M?
- A. 8.00 grams
- B. 0.0730 grams
- C. 0.365 grams
- D. 0.080 grams
8. Based on Tables 2, 3, and 4, what is the best estimate that can be made of how many ml of the NaOH titrant it took to neutralize the HCl solutions used in trials 1, 2, and 3?
- A. 20.00, 10.00, 22.00
- B. 22.00, 10.00, 20.00
- C. 09.99, 21.95, 20.10
- D. 20.10, 09.99, 21.95
9. How many ml of titrant were used in the trials?
- A. enough to neutralize the HCl
- B. at least 30
- C. enough to reach the maximum pH
- D. exactly 30
10. What substances should we expect to discover in the titrated solution at the end of the trials?
- A. NaCl
- B. NaOH
- C. NaOH and NaCl
- D. NaOH, NaCl, and NH3
11. How should the mass of HCl in the titrated solution be calculated?
- A. (c × v) × 40.0 g, where c is the concentration of the titrant (0.2 moles/liter) and v is the volume in liters of the titrant used to reach
pH 7.0. - B. (c × v) × 36.5 g, where c is the concentration of the titrant (0.2 moles/liter) and v is the volume in liters of the titrant used to reach
pH 7.0. - C. It is equal to the number of ml of titrant used.
- D. Heat the neutralized solution until all water is evaporated and weigh the solid crystals that remain.
ACT Science Passage III—Conflicting Viewpoints
A geneticist and a physiologist each explained what causes the wide variety of different height profiles found among different countries and ethnic groups on the planet.
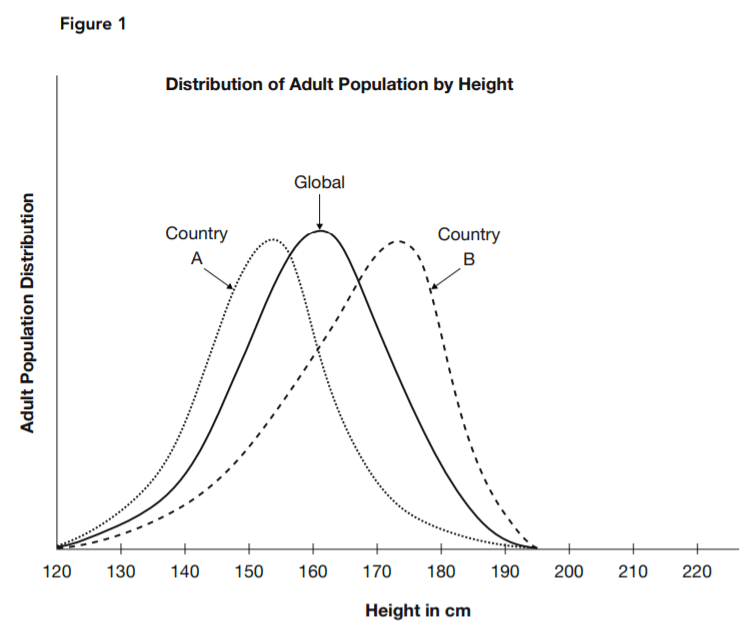
The geneticist pointed to data such as that represented by Figure 1. Each curve shows the reported distribution of the specified adult population over the spectrum of heights. One represents an estimate of global averages, and the other two are estimates for two countries. He argued that the distinctive height profile of each separate population grouping supported the hypothesis that height is determined by
each gene pool.
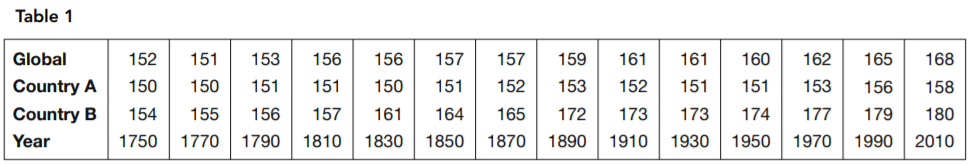
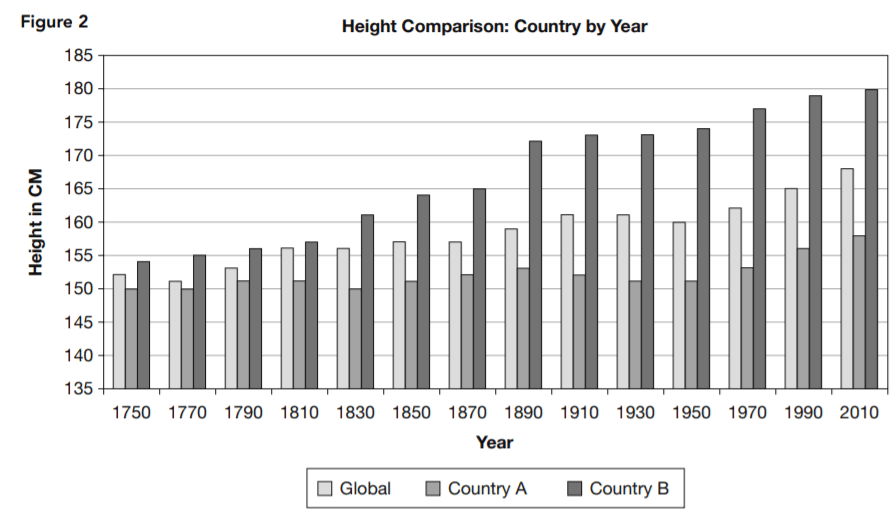
The physiologist said there were significant differences between the global profile and those of the two countries in terms of nutritional and other health-related factors. She also pointed to estimated historical data. Table 1 and the bar chart in Figure 2 present an image of long-term trends in typical height. She argued that if genetics determined the height, no such change would occur.
12. Based on Figure 1, what is a typical height in country A?
- A. 180 cm
- B. 168 cm
- C. 153 cm
- D. 70 cm
13. Based on Figure 1, what is the most typical height in country B?
- A. 174 cm
- B. 168 cm
- C. 158 cm
- D. 70 cm
14. What is the best description of the relationship between the shapes of the three curves shown in Figure 1?
- A. There is no significant relationship.
- B. The shapes are identical, but the positions of the curves for countries A and B are shifted to the left and right, respectively, of the
global curve. - C. All three are approximately in the same position, but their shapes are different. The global curve is symmetrical. Country A
increases more steeply from shorter heights to its peak, remaining above the global curve, and then decreases more steeply, remaining below the other two curves as it descends to the right. Country B’s curve increases gradually from the left, remaining below the other two curves until it approaches its peak; then it descends more steeply to the right but always remains above the other two curves. - D. They are scientifically identical.
15. Which statement is supported by Table 1 and Figure 2 but not supported by Figure 1?
- A. None. Table 1 and Figure 2 present the same basic data as Figure 1 but in different formats.
- B. For significant time periods, some countries experience changes in typical adult height in approximately the same pattern as others.
- C. When more people move from country to country, genetic diversity produces taller adults.
- D. Some countries have larger typical adult heights than others.
16. Which is the most complete statement about country B supported by Table 1 and Figure 2?
- A. The adults of country B have been above the global typical height since at least 1750, and this difference has increased significantly
throughout the period from 1750 to 2010. - B. Country B’s adults started out taller than any other country’s, and they’ve been getting taller at an increasing rate.
- C. Country B must have had difficulties between 1890 and 1910 because the rate of increase in height of its people leveled off in
that period. - D. The height of country B’s adults increased even when country A’s decreased.
17. Which statement about country A is supported by Table 1 and Figure 2?
- A. The height of country A’s adults increased even when country B’s decreased.
- B. Country A’s adults started out shorter than any other country’s, but they’ve been gaining slowly and consistently.
- C. Country A’s adults increased barely half as much in height as country B’s between 1750 and 2010.
- D. The adult height in country A became smaller during two periods reported.
18. What hypothesis is supported by a comparison of the three curves in Figure 1?
- A. People in country B are better nourished than those in either the global average or country A.
- B. Country A needs a national fitness program.
- C. The upper and lower limits of adult human height are relatively constant in different countries, but the typical height varies from
country to country. - D. People in crowded areas are smaller than people in rural areas.
ACT Reading Passage IV—Research Summary
NASA is operating the satellite-based Solar Radiation and Climate Experiment (SORCE). Its purpose is to improve our understanding of the nature, including changes in quality and intensity, of solar radiation reaching our planet, by continuously monitoring the intensity of solar radiation by time and by frequency.
Five different instruments are mounted in the satellite to achieve coverage of the desired spectrum range. Table 1 shows the instruments used and the wavelength (λ) range monitored by each. Figure 1 illustrates how they are arranged in the satellite.
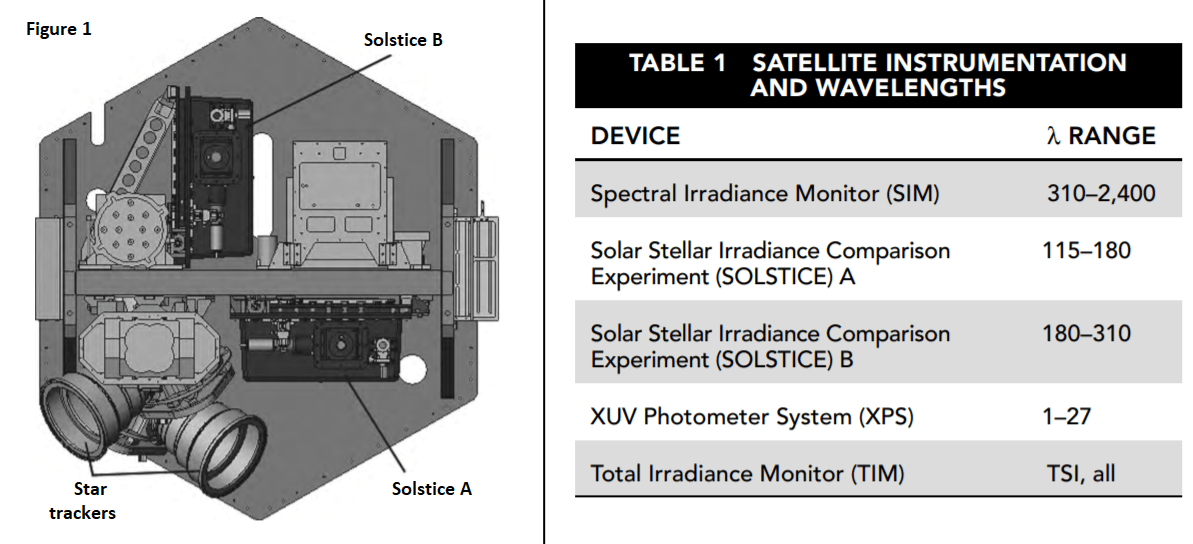
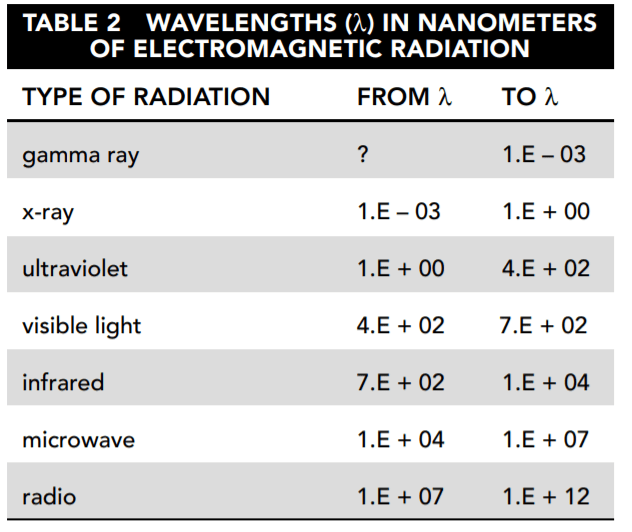
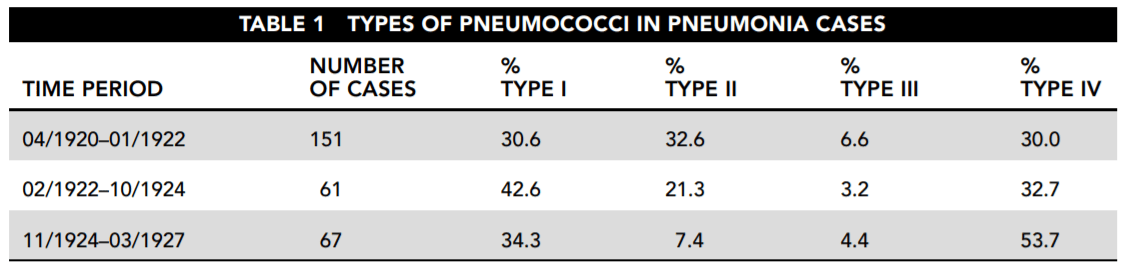
Table 2 names the major categories of electromagnetic radiation and shows the frequency range included in each.
Experiment 1
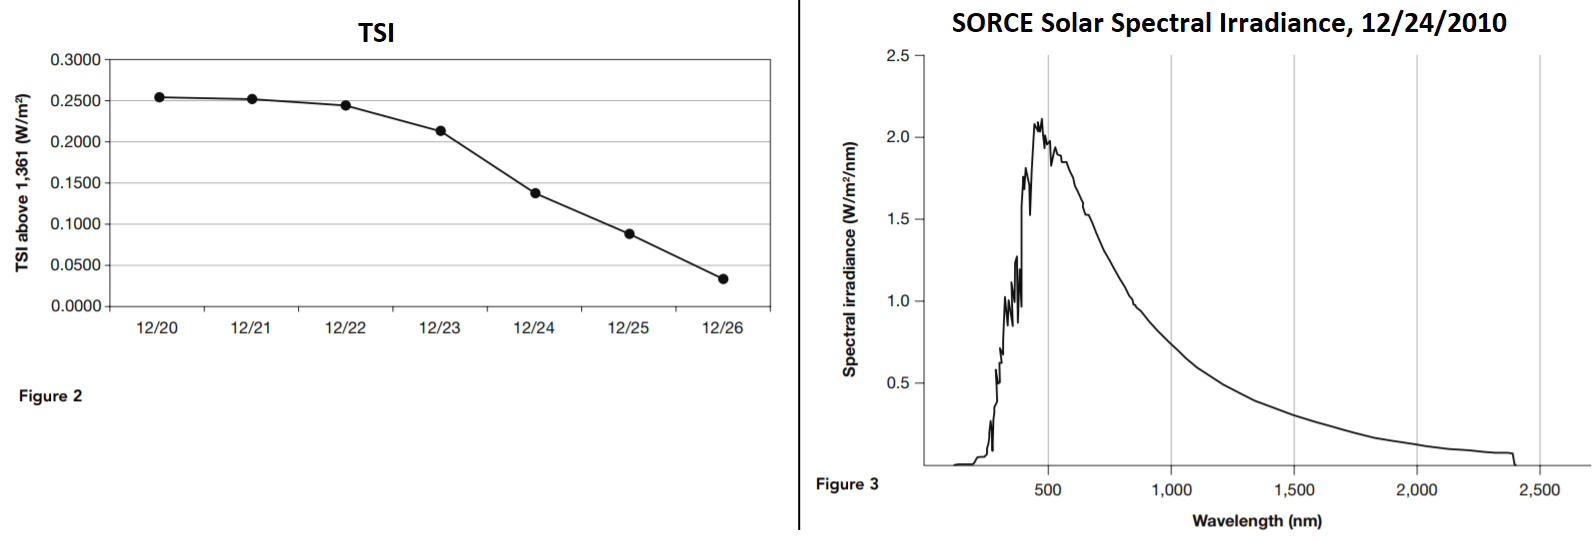
The Total Irradiance Monitor (TIM) monitors the total solar irradiance (TSI) over the entire electromagnetic spectrum. Figure 2 shows the average daily TSI, measured in watts/meter2 (W/m2) as measured by the TIM for December 20 through 26, 2010.
Experiment 2
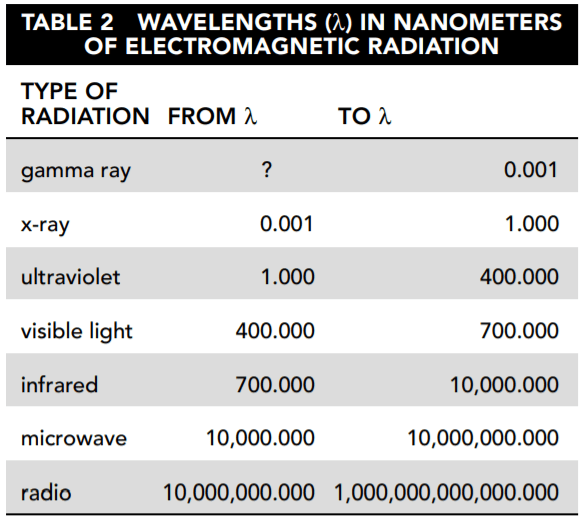
The other instruments measure irradiance by wavelength. This measure is called solar spectral irradiance (SSI). Figure 3 shows the SSI for December 24, 2010, in watts/meter2/nanometer (W/m2/nm). This is a measure of the intensity of solar irradiance by wavelength.
19. Based on Tables 1 and 2, which types of electromagnetic radiation are measured in the SORCE experiment by instruments other than the TIM?
- A. gamma ray, x-ray, visible light
- B. x-ray, ultraviolet, visible light, infrared
- C. radio, microwave, infrared, ultraviolet
- D. visible
Translated from scientific notation to standard notation, Table 2 looks like this:
The SIM covers part of the ultraviolet, visible light, and infrared spectrums. SOLSTICE A and B each cover part of the ultraviolet range. XPS begins at 1 nm, which is the upper end of the x-ray range, and extends into the ultraviolet range.
20. According to Table 2 and Figure 3, what is the difference between the lowest and the highest daily average of total solar irradiance (TSI)?
- A. 0.2184 W/m2
- B. 0.2184 W/m2/nm
- C. 1.E + 10 W/m2
- D. 2,513.E − 4 W/m2
21. Approximately what proportion of the average daily solar irradiance is the difference between the week’s highest level and its lowest level?
- A. 1.6000
- B. 1/ 150
- C. 1 / 1,000
- D. 1.5 E-4
22. Based on Figure 3, which wavelength transmitted the highest level of solar irradiance?
- A. 2,500 nm
- B. 2.0 nm
- C. 460 nm
- D. 460 Hz
23. What best describes the difference between total solar irradiance (TSI) and solar spectral irradiance (SSI)?
- A. TSI is the total amount of power delivered through a given cross-sectional area. SSI is the residual effect of that power after it has
passed. - B. TSI is the total amount of power delivered through a given cross-sectional area. SSI provides a profile of solar irradiance delivered by wavelength range.
- C. TSI is the total solar energy measured. SSI is the profile of solar energy delivered by wavelength range.
- D. TSI is the total solar energy measured in space. SSI is the energy level that strikes the earth.
24. Based on Figure 3 and Table 1, which type of electromagnetic radiation carries the most solar irradiance?
- A. gamma ray
- B. visible light
- C. microwave
- D. infrared
25. Refer again to Figure 3. After visible light, which type of electromagnetic radiation carries the most solar irradiance?
- A. ultraviolet
- B. radio waves
- C. infrared
- D. x-ray
ACT Science Passage V—Research Summary
Microbe populations, including those of disease-producing bacteria, can change their characteristics over relatively short periods of time. A series of experiments involving pneumococci were conducted to determine whether and how these changes take place. In all three of the experiments described here, measures were taken to protect against contamination from other bacteria throughout the course of the
experiments.
Experiment 1
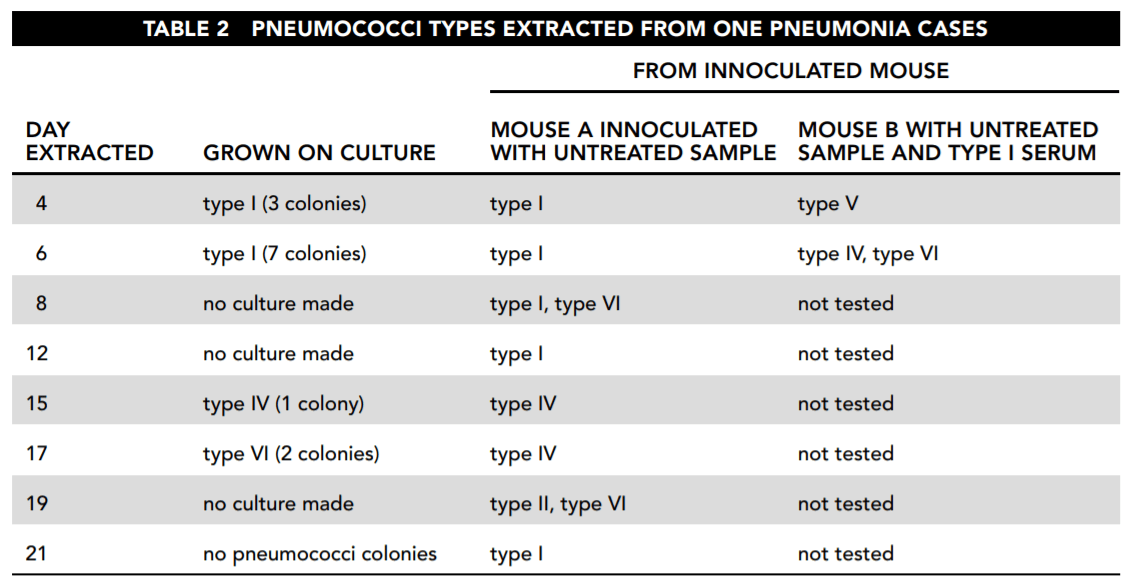
A five-year study was conducted of the prevalence of each type of pneumococcus found in pneumonia victims. Table 1 shows the results. For the purpose of simplification, the pneumococcal types I through VI referred to here do not necessarily correspond either to those used in the original study or to those in current usage.
Experiment 2
A subsequent study was conducted to determine what happens to strains of pneumococci in a disease victim. It examined changes both to the pneumococci infecting the victim and to those extracted from the victim.
First, samples were taken from a patient who was initially analyzed to be infected only with type I pneumococci. Cultures were grown from these samples in three ways and analyzed. The first was simply to grow bacterial colonies from the sample in petri dishes. The second was to examine what happened when the same bacteria infected others. Mouse A was inoculated with untreated infected material. Then mouse B was inoculated with type I serum, which kills type I bacteria, and with the infected material from the patient. Table 2 reports those results. (Note: each day a different mouse B and mouse A were used.)
Experiment 3
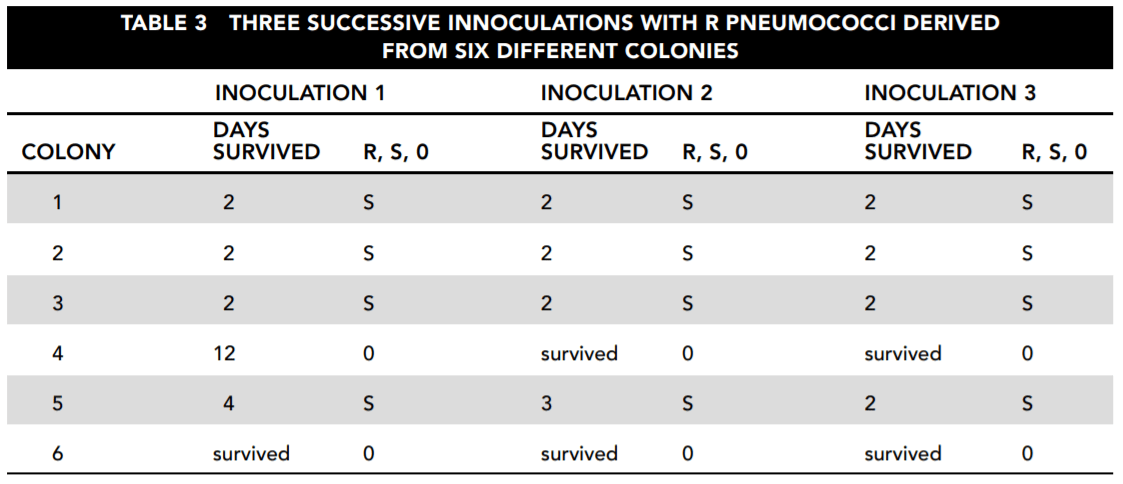
The next experiment examined the changes that occurred when bacteria from six different pneumococcal colonies were used to inoculate mice. These colonies were cultured in laboratory conditions to eliminate uncertainties of the previous experiments. All of these colonies were of rough (R) bacteria. Bacteria can be divided into smooth or encapsulated (S) and rough or unencapsulated (R). The smooth, encapsulated bacteria are the most dangerous because they are coated with material that protects them from antigens. The rough, unencapsulated bacteria are usually harmless.
In each case, a mouse was inoculated with R bacteria from the colony. The mice either died after between 2 and 12 days or survived indefinitely. The blood of each deceased mouse was then cultured and tested for pneumococci that were examined to determine whether they were R or S bacteria. Table 3 reports the results.
26. Consider the results reported in Table 2. Which of the following statements about the samples taken directly from the patient and culture is correct and important for the study?
- A. The patient was cured by day 19.
- B. Although the patient started with evidence of only type I infection, that disappeared, to be replaced by first type IV and then type VI
infection. - C. The type I bacteria died of overpopulation after day 6.
- D. Type IV bacteria are the mildest of those involved with this disease.
27. Based on the overall findings reported by Table 2, which of the following answers is most correct?
- A. The mice became infected with whatever bacteria the patient was infected with when the sample was taken.
- B. The appearance of type VI bacteria indicates that the disease has run its course.
- C. Bacteria change by escalating from lower types to higher types.
- D. The type of bacteria changes both in the patient and in the mice inoculated with the patient’s infection, without any clear relationship between the two.
28. From the standpoint of understanding how bacterial strains change over time, what is the most interesting thing about the results reported in Table 3?
- A. Any of the mice survived.
- B. All of the bacterial strains, without exception, changed from R to S.
- C. There was only one fatality in the mice inoculated with strains 4 and 6, and that took much longer than the deaths caused by
the other strains. - D. All of the bacterial strains extracted and tested exhibited a change from R to S.
29. Which answer is the most important statement supported by the data reported from the three experiments?
- A. All bacteria are potential killers.
- B. Pneumococcus strains do apparently shift their characteristics significantly over time, and it is possible to learn about the conditions under which this happens.
- C. Mice are more susceptible to disease than humans.
- D. Bacteria undergo random mutations that we cannot predict.
30. Which statement is best supported by the data in Table 2, viewed in conjunction with the other data?
- A. A single type of bacterium infects the victim and then reproduces until it kills the patient or the patient kills it.
- B. The progress of the disease involves changes not only in the intensity but also in the nature of the infection.
- C. The bacterial strain causing the infection will tend to destroy itself.
- D. The bacteria can never be completely eliminated.
ACT Science Passage VI—Data Representation
Variations in the proportion of the two major isotopes of oxygen, 18O and 16O, in seawater or landbased water, including glacial ice, are believed to be a proxy for changes in temperature. 16O is lighter than 18O, so it evaporates first from seawater. This leaves a higher concentration of 18O in seawater and a lower concentration in the evaporated water, which then falls to Earth as precipitation. If the falling water freezes, glaciers are formed, which trap the low 18O precipitated water. In glacial periods, oceans are richer in 18O, but in interglacial periods the glaciers melt and 16O-rich water flows back into the oceans. For this reason high 18O concentrations in seawater are believed to be an indication of cold climate periods in which glaciers are built up.
The measure of how far above normal the concentration of 18O in a sample it is called δ18O. It is computed as follows:
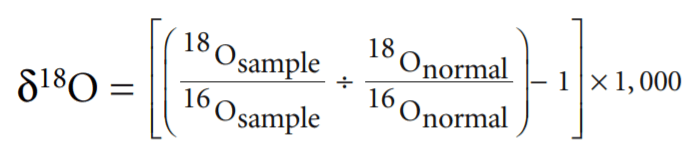
Thus high δ18O means more 18O and less 16O than normal. Low δ18O is the reverse. Figure 1 illustrates the δ18O cycle from seawater
to the atmosphere to glaciers on land and back to seawater.
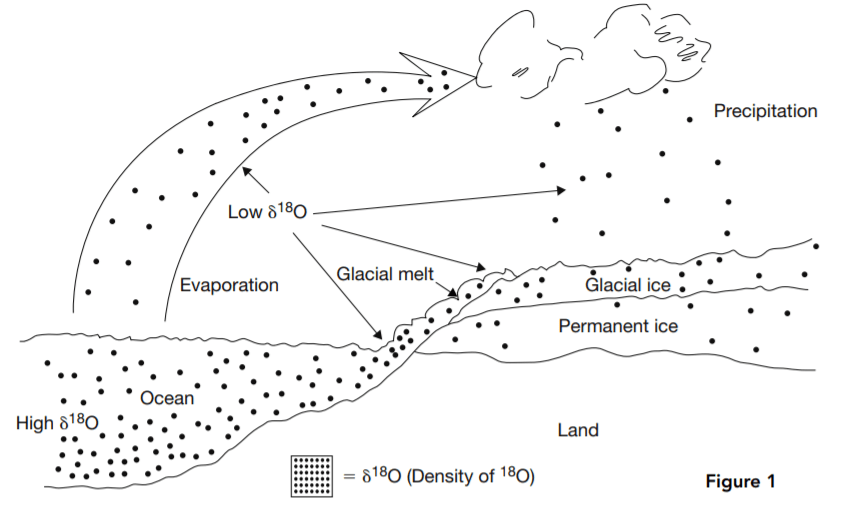
Low δ18O water evaporates from the ocean, leaving higher δ18O water behind. The evaporated water falls as precipitation, forming low δ18O glaciers. In interglacial periods, the glaciers melt, and 16O flows back into the ocean, reducing δ18O there.
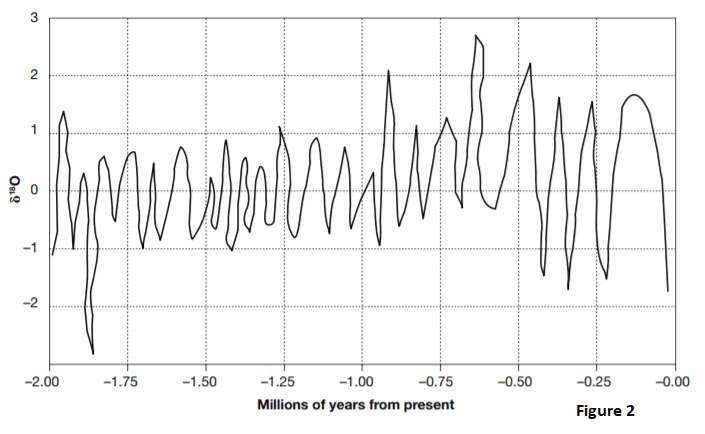
Figure 2 is a simplified representation of the changes in seawater δ18O for the past 2,000,000 years. The high δ18O periods are when 16O evaporates from the seawater and is frozen into glaciers. The low δ18O periods are when the glaciers melt and return the 16O to the seawater.
31. Based on Figure 2 and the relationship between δ18O, glaciation, and climate, how long ago was the period with the coldest temperatures and the most glaciation?
- A. 1.85 million years
- B. 0.12 million years
- C. 0.65 million years
- D. Between 1.00 and 1.75 million years
32. Based on Figure 2 and the relationship between δ18O and the return of melted glaciers to the ocean, how long ago would sea levels have been highest?
- A. 0.65 million years
- B. 0.90 million years
- C. 1.93 million years
- D. 1.85 million year
33. Referring to Figure 2, how many periods of glacial buildup occurred between 0.25 and 0.50 million years ago?
- A. three
- B. two
- C. one
- D. six
34. Based on Figure 2, what is the highest number of glacial melting periods to occur within one 0.25-million-year span?
- A. three
- B. five
- C. two
- D. four
35. During what period shown on Figure 2 were the temperature swings between glacial buildups and glacial melts consistently the most mild over an extended period of time?
- A. −0.50 to −0.85 million years
- B. −0.90 to −1.75 million years
- C. 0.00 to –0.50 million years
- D. −1.85 to −2.00 million years
ACT Science Passage VII—Data Representation
Valency is a concept in chemistry that provides rules for determining which chemical elements can combine in what proportions to form compound substances. Protons and neutrons together form the nucleus at the center of an atom. The much lighter electrons whirl around the nucleus in what are called shells, rings, orbits, or energy levels. The left-hand diagram in Figure 1 is a representation of this structure.
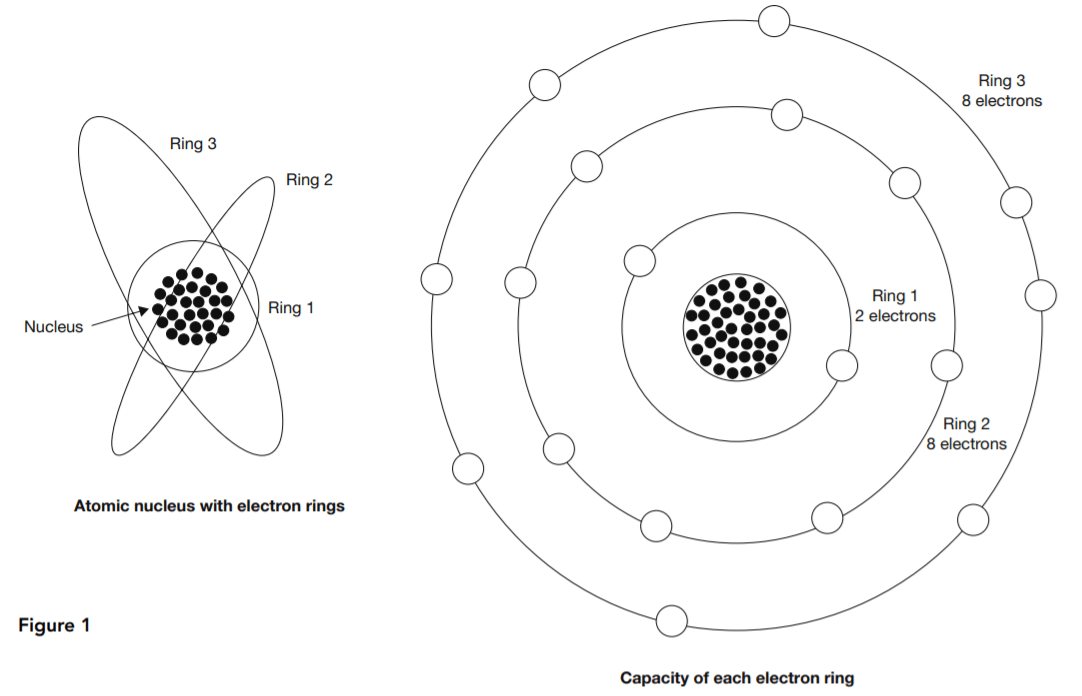
At right in Figure 1 is a representation of valency. Each electron ring has a normal electron capacity. The first ring’s capacity is two electrons. The other rings each have a capacity of eight electrons. Atoms tend to bring their outer rings to capacity through some kind of collaboration or exchange with other atoms. The valency of an atom is the number of surplus or deficit electrons in its outer ring.
Ionic bonding involves a combination of atoms having only one or two electrons in their outer rings with others that need only one or two electrons to complete their outer rings. The first type empty their incomplete outer rings by lending out their outer-ring electrons, and the second type borrow them to complete their outer rings. This is called ionic bonding because the atoms become electrically charged ions. The attraction between the positive ions that give up their electrons and the negative ions that receive them helps to bind the resulting compound.
Figure 2 shows how this works in the case of two common substances, H2O and NaCl, water and salt.
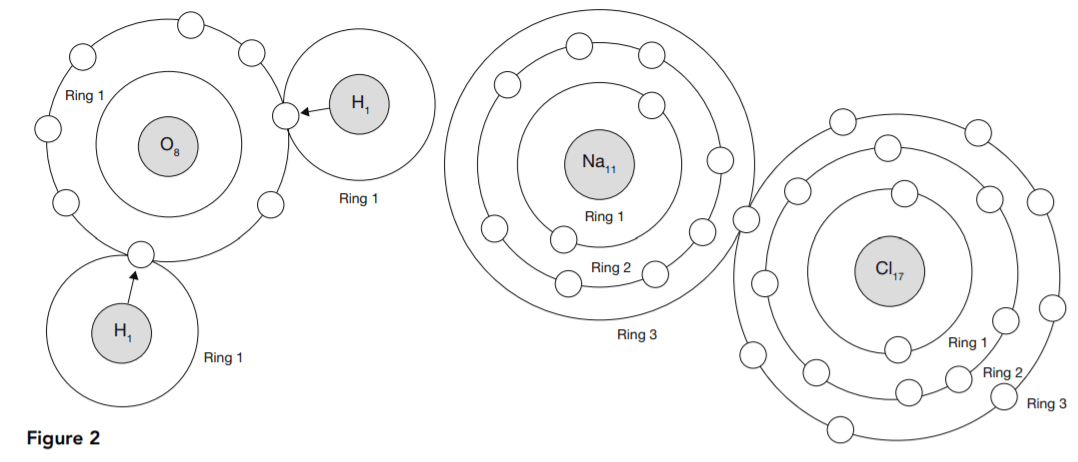
Tables 1 and 2 show how each atom borrows or loans electrons either to complete or to empty its outer ring.
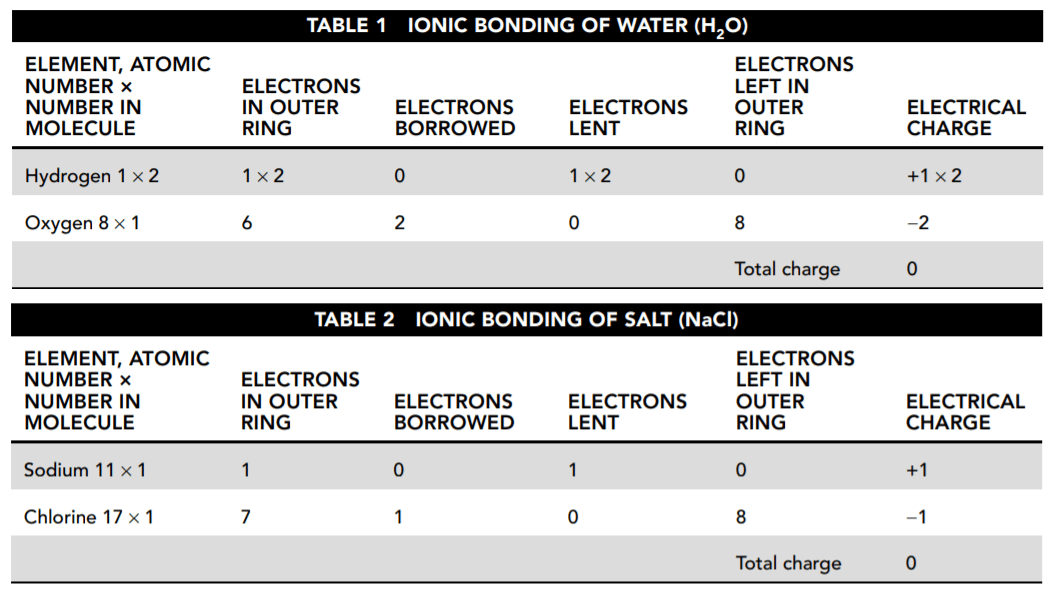
36. According to Tables 1 and 2, what is the resulting charge of each compound?
- A. H2O is positive and NaCl is negative.
- B. They are both negative.
- C. NaCl is positive and H2O is neutral.
- D. They are both neutral.
37. Refer to Tables 1 and 2 and Figure 1. When sodium (Na) is stripped of the one electron in its outer shell, what is its electrical charge?
- A. +1
- B. 10
- C. −1
- D. 11
38. Based on Figure 2 and the explanations presented here, how many electron rings does a positive sodium ion have?
- A. one
- B. two
- C. three
- D. none
39. Based on the data presented here about ionic bonding, which element other than sodium would chlorine (Cl) be most likely to form an ionic bond with?
- A. oxygen
- B. itself
- C. Hydrogen and oxygen are equally likely.
- D. hydrogen
40. As shown in Figure 2 and Table 1, hydrogen and sodium each have only one electron in their outer rings. In light of the information presented here, what is the best explanation for why it takes one sodium atom to form a compound with one chlorine atom, but it takes two hydrogen atoms to form a compound with one oxygen atom?
- A. Hydrogen is atomic number 1, and sodium is 11. It takes more hydrogen atoms to balance the weight of oxygen than sodium atoms to balance chlorine.
- B. The electrons of sodium and chlorine total 28, which is an even number. Two hydrogen atoms are required to produce an even number of electrons with oxygen.
- C. Chlorine needs only one electron to complete its outer ring. Oxygen needs two. One sodium atom provides the one electron that chlorine needs, but it takes two hydrogen atoms to provide the two electrons that oxygen needs.
- D. Sodium and chlorine start with the same number of electron rings, but hydrogen has only one ring to oxygen’s two.