Mean Median Mode Practice Test 2026 Question Answers
Last Updated on June 29, 2026
Mean Median Mode Practice Test Question Answers [PDF Worksheet]: The information collected in the form of numbers is called Data. Data is organized and represented graphically so that it becomes easy to understand and interpret. The difference between the highest and lowest observations in a given data is called its Range.
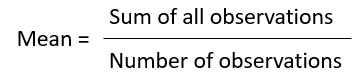
The average Arithmetic Mean or mean of a given data is defined as :
The mode is the observation that occurs most frequently in the data. When the given data is arranged in ascending (or descending) order, then the middlemost observation is the median of the data.
Mean, median, and mode are the representative values of a group of observations. They are also called the measures of the central tendency of the data.
1. The range of the data 14, 6, 12, 17, 21, 10, 4, 3 is
🔘 A. 6
🔘 B. 12
🔘 C. 16
🔘 D. 17
🔘 E. 18
Show Answers
Answer: E 18 (Higher Value (21) – Lowest Value (3) =18)
2. The mode of the data 21, 26, 22, 29, 23, 29, 26, 29, 22, 23 is
🔘 A. 21
🔘 B. 22
🔘 C. 23
🔘 D. 26
🔘 E. 29
Show Answers
Answer: E 29 (29 is occurs most frequently in the data.)
3. The median of the data 23, 49, 87, 75, 88, 59, 89 is
🔘 A. 49
🔘 B. 87
🔘 C. 75
🔘 D. $ 88
🔘 E. 59
Show Answers
Answer: C 75 (75 is the middle most observation is the given median of the data)
4. Find the median of the data: 13, 111, 17, 12, 15, 19, 19, 12, 110, 115, 17
🔘 A. 12
🔘 B. 15
🔘 C. 19
🔘 D. 17
🔘 E. 110
Show Answers
Answer: D 14 (Arranging in ascending order. 12, 12, 13, 15, 17, 17, 19, 19, 110, 111, 115) Since number of observations is odd, the middle most value is the median. The middle most value is 17, somedian is 17.
5. Find the median of the data 39, 30, 80, 28, 20, 71, 19, 11, 60, 17
🔘 A. 28
🔘 B. 20
🔘 C. 71
🔘 D. 30
🔘 E. 24
Show Answers
Answer: E 24 ( Arranging in ascending order 11, 17, 19, 20, 28, 30, 39, 60, 71, 80) Since number of observations is even, the median is given by finding the average or mean of the two middle most observations So, median is (20+28) ÷ 2 = 24 (Note : In this data, there are two middle most terms 20 and 28. So, median
is the average of these observations.)
6. If the mean of 26, 28, 25, x, 24 is 27, find the value of x.
🔘 A. 2
🔘 B. 3
🔘 C. 12
🔘 D. 23
🔘 E. 32
Show Answers
Answer: E 32 (Use the above mean formula 27 =(26 + 28 + 25 + x+ 24) ÷ 5)
7. The mean of 10 observations was calculated as 40. It was detected on rechecking that the value of 45 was wrongly copied as 15. Find the correct mean.
🔘 A. 13
🔘 B. 23
🔘 C. 27
🔘 D. 33
🔘 E. 43
Show Answers
Answer: E 43 (formula 40 = (Sum of all observations) ÷ 10 = So, sum of all observations = 400 (correct sum = Incorrect sum – Incorrect observation + correct observation) and Correct Mean=(Correct Sum ÷ Number of observations))
8. The median of observations 11, 12, 14, 18, x + 2, 20, 22, 25, 61 arranged in ascending order is 21. Find the value of x.
🔘 A. 19
🔘 B. 20
🔘 C. 22
🔘 D. 25
🔘 E. 61
Show Answers
Answer: A 19 (formula Median from data = x + 2 or, 21 = x + 2 or, x = 19)
9. The number of coffeebar in different street of a NY city are 9, 18, 24, 9, 5, 9, 3 and 9. The mode of this data is
🔘 A. 3
🔘 B. 5
🔘 C. 9
🔘 D. 18
🔘 E. 24
Show Answers
Answer: C 9 (3, 5, 9, 9, 9, 9, 18, 24) Here, 9 occurs more frequently: I.e. 4 times.
Mode of data 9: Note Mode is the observation that occurs most frequently in the data.
10. The mean of three numbers is 40. All the three numbers are different natural numbers. If the lowest is 19, what could be the highest possible number of the remaining two numbers?
🔘 A.
🔘 B.
🔘 C.
🔘 D. $
🔘 E.
Show Answers
Answer: D 1100 (formula of Simple interest I = (P × R × T)/100)