
Last Updated on June 29, 2026
SAT Reading Practice Test 3 (Free Printable Worksheet): You can download the SAT Reading Practice Test 3 for your Scholastic Assessment Test preparation.
SAT Reading Practice Test 3
| Test Name | SAT Practice Test |
| Subject | Sample SAT Reading Test |
| Passage Topic | Science |
| Total Question | 10 |
| Total Passage | 1 |
| Answers and Explanation | Yes |
| Printable PDF Worksheet | Yes |
| Editable DOC | Yes |
Questions 1–10 are based on the following passage and supplementary material.
This passage is adapted from Kevin Drum, “America’s Real Criminal Element: Lead” ©2013 Mother Jones.
Experts often suggest that crime resembles an epidemic. But what kind? Economics professor Karl Smith has a good rule of thumb for categorizing epidemics: If it spreads along (5) lines of communication, he says, the cause is information. Think Bieber Fever.1 If it travels along major transportation routes, the cause is microbial. Think influenza. If it spreads out like a fan, the cause is an insect. Think malaria. But (10) if it’s everywhere, all at once—as both the rise of crime in the ’60s and ’70s and the fall of crime in the ’90s seemed to be—the cause is a molecule.
A molecule? That sounds crazy. What molecule could be responsible for a steep and (15) sudden decline in violent crime?
Well, here’s one possibility: Pb(CH2CH3)4. In 1994, Rick Nevin was a consultant working for the US Department of Housing and Urban Development on the costs and benefits of (20) removing lead paint from old houses. A growing body of research had linked lead exposure in small children with a whole raft of complications later in life, including lower IQ, hyperactivity, behavioral problems, and learning disabilities. (25) A recent study had also suggested a link between childhood lead exposure and juvenile delinquency later on. Maybe reducing lead exposure had an effect on violent crime too?
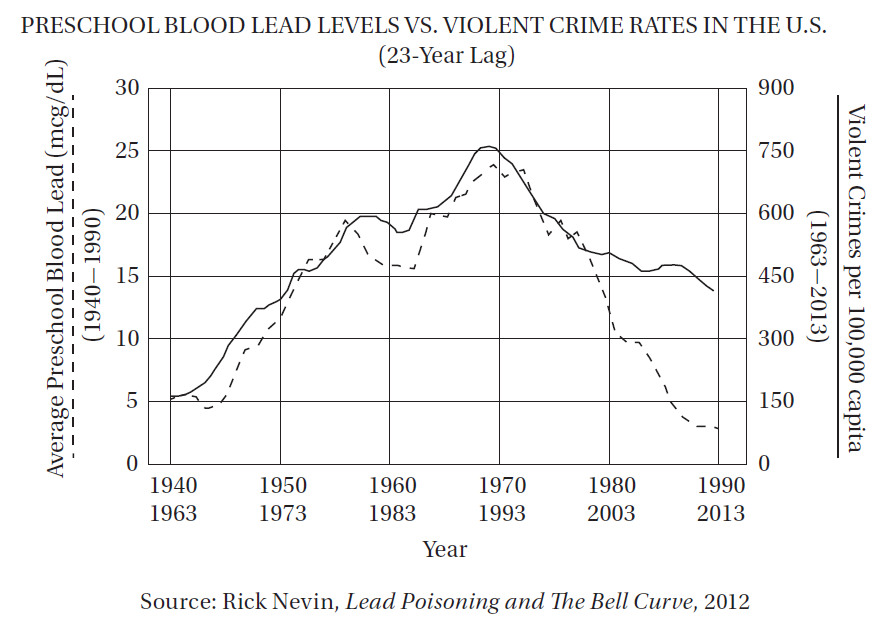
That tip took Nevin in a different direction. The (30) biggest source of lead in the postwar era, it turns out, wasn’t paint, but leaded gasoline. If you chart the rise and fall of atmospheric lead caused by the rise and fall of leaded gasoline consumption, you get an upside-down U. Lead emissions from (35) tailpipes rose steadily from the early ’40s through the early ’70s, nearly quadrupling over that period. Then, as unleaded gasoline began to replace leaded gasoline, emissions plummeted.
Intriguingly, violent crime rates followed the (40) same upside-down U pattern (see the graph). The only thing different was the time period. Crime rates rose dramatically in the ’60s through the ’80s, and then began dropping steadily starting in the early ’90s. The two curves looked eerily (45) identical, but were offset by about 20 years.
So Nevin dug up detailed data on lead emissions and crime rates to see if the similarity of the curves was as good as it seemed. It turned out to be even better. In a 2000 paper he concluded (50) that if you add a lag time of 23 years, lead emissions from automobiles explain 90 percent of the variation in violent crime in America. Toddlers who ingested high levels of lead in the ’40s and ’50s really were more likely to become violent (55) criminals in the ’60s, ’70s, and ’80s. And with that we have our molecule: tetraethyl lead, the gasoline additive invented by General Motors in the 1920s to prevent knocking and pinging in high-performance engines. As (60) auto sales boomed after World War II, and drivers in powerful new cars increasingly asked service station attendants to “fill ’er up with ethyl,” they were unwittingly creating a crime wave two decades later.
(65) It was an exciting conjecture, and it prompted an immediate wave of . . . nothing. Nevin’s paper was almost completely ignored, and in one sense it’s easy to see why—Nevin is an economist, not a criminologist, and his paper (70) was published in Environmental Research, not a journal with a big readership in the criminology community. What’s more, a single correlation between two curves isn’t all that impressive, econometrically speaking. Sales of vinyl LPs rose (75) in the postwar period too, and then declined in the ’80s and ’90s. No matter how good the fit, if you only have a single correlation it might just be coincidence. You need to do something more to establish causality. (80)
So in 2007, Nevin collected lead data and crime data for Australia, Canada, Great Britain, Finland, France, Italy, New Zealand and West Germany. Every time, the two curves fit each other astonishingly well.
(85) The gasoline lead hypothesis helps explain some things we might not have realized even needed explaining. For example, murder rates have always been higher in big cities than in towns and small cities. Nevin suggests that, (90) because big cities have lots of cars in a small area, they also had high densities of atmospheric lead during the postwar era. But as lead levels in gasoline decreased, the differences between big and small cities largely went away. And guess (95) what? The difference in murder rates went away too. Today, homicide rates are similar in cities of all sizes. It may be that violent crime isn’t an inevitable consequence of being a big city after all.
Q1. In the first paragraph, Karl Smith’s work is presented primarily as
- A) a controversial sociological hypothesis.
- B) a warning about potentially dangerous conomic trends.
- C) a useful model for conceptualizing a variety of phenomena.
- D) a potential medical solution to a persistent social problem.
Q2. The author suggests that promising research in the social sciences is sometimes ignored because it
- A) is not presented by authorities with the proper credentials.
- B) is not supported by controlled scientific experiments.
- C) relies on complex mathematical calculations that are not easily understood.
- D) uses historical data that are not necessarily valid in the modern era.
Q3. Which of the following provides the strongest evidence for the answer to the previous question?
- A) Lines 25–27 (“A recent study . . . later on”)
- B) Lines 49–52 (“In a 2000 paper . . . America”)
- C) Lines 68–72 (“Nevin is . . . community”)
- D) Lines 72–74 (“What’s more . . . speaking”)
Q4. According to the graph for which of the following time periods was the percent increase in per capita violent crime the greatest?
- A) 1940–1970
- B) 1963–1993
- C) 1970–1990
- D) 1993–2013
Q5. According to the graph, which decade of violent crime statistics provides the LEAST support to Rick Nevin’s hypothesis?
- A) 1963–1973
- B) 1980–1990
- C) 1983–1993
- D) 2003–2013
Q6. The author mentions “sales of vinyl LPs” (line 74) primarily as an example of
- A) another economic factor that may explain a social trend.
- B) how harmful chemicals can be spread via consumer products.
- C) a statistic that may be more coincidental than explanatory.
- D) a counterintuitive trend in consumer behavior.
Q7. The “complications” in line 22 are
- A) obstacles to gathering relevant data.
- B) controversies about theoretical models.
- C) challenges to the implementation of social policies.
- D) psychological problems.
Q8. The author regards the “drivers” in line 60 as
- A) inadvertent abettors.
- B) unintentional heroes.
- C) greedy consumers.
- D) devious conspirators.
Q9. In line 49, “even better” most nearly means
- A) less controversial.
- B) more correlative.
- C) easier to calculate.
- D) more aesthetically engaging.
Q10. The final paragraph (lines 85–98) serves primarily to
- A) suggest topics for future research.
- B) concede a theoretical drawback.
- C) propose a novel alternative.
- D) describe a supportive implication.
Free SAT Reading Practice Test 3 Printable Worksheet
| Document Type | Download Link |
| Free Editable Doc File | |
| Free Printable PDF File |
See Also:
- SAT Practice Test 2026 Official (40+ Free PDF) with Study Guide
- Digital SAT Practice Test 2026 Official Study Guide [PDF]
- SAT Reading Practice Test 1
- SAT Reading Practice Test 2
- SAT Reading Practice Test 3
Sample Reading Tests
Sample Math Tests
Sample English Grammar Tests
Sample Critical Reading Tests